Data Visualization on Urban Forest in Melbourne
Project information
- Category: Data Science
- Client: University
- Project date: Aug-2020 to Oct-2020
- Project URL : Urban Forest Visualization
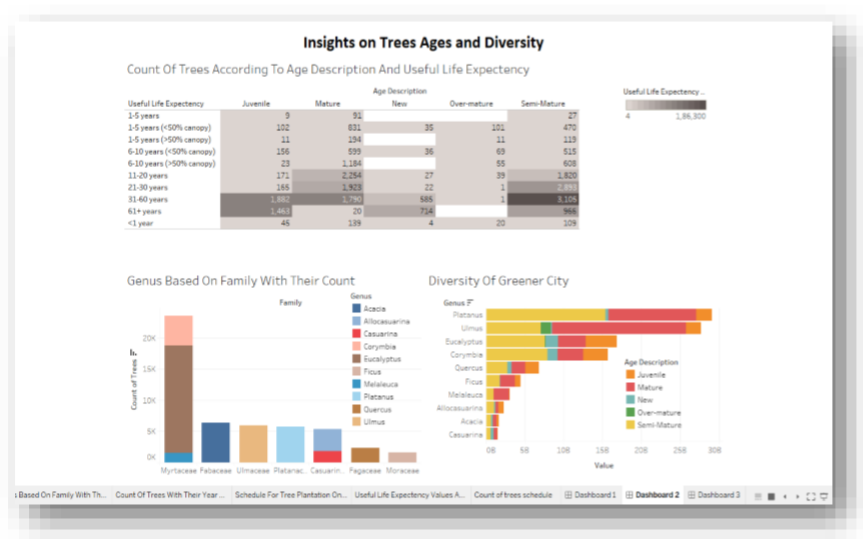
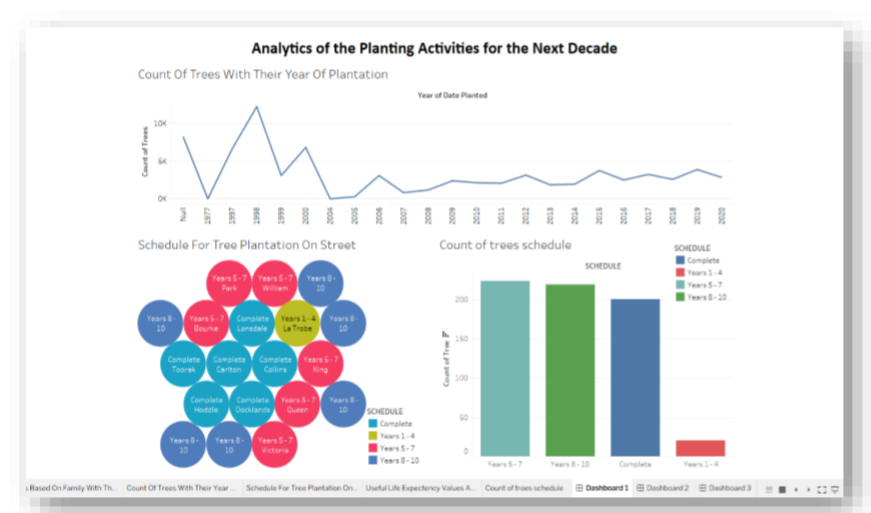
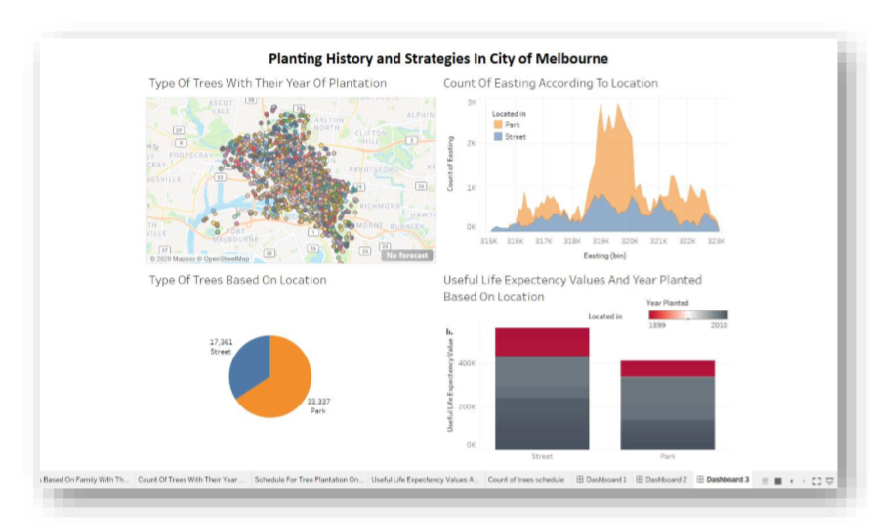
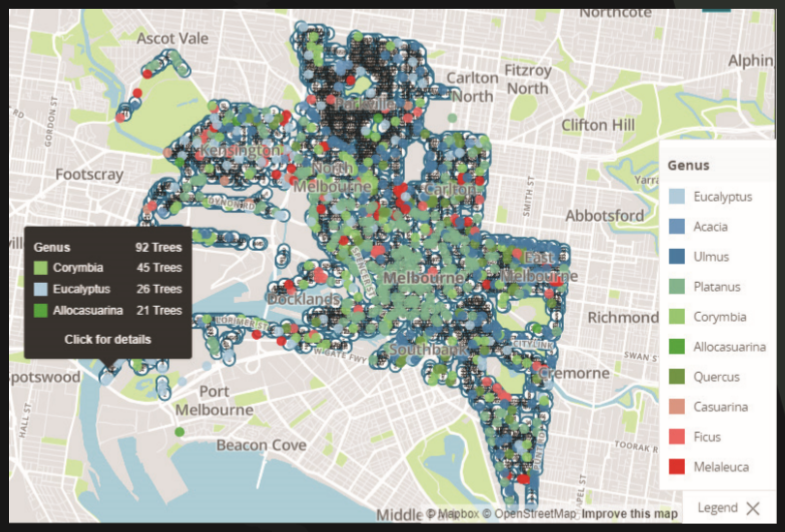
Summary: Developed detailed visualizations to interpret different plantation strategies implemented in Melbourne city to reduce environmental damage.
Tools: Python, Tableau, NumPy, Pandas, SciPy, and Matplotlib
Duties: It was an individual project. I collected the data from different sources performed the necessary steps to prepare the data and explored the dataset for basic insights. After the preparation of the dataset, I conduct a visualization analysis on the dataset using tableau software and developed 3 different dashboards representing different insights.
Outcome: Created efficient and interactive dashboards and published them on Tableau Public, also got a sound understanding of correct visualization attributes and steps behind hypothesis and chart building formation.
Result: Obtained Distinction for this project.